> ## Documentation Index
> Fetch the complete documentation index at: https://docs.p36-csq.com/llms.txt
> Use this file to discover all available pages before exploring further.
# Deviations
> Deviation details and tracking for Use Cases
## Deviations
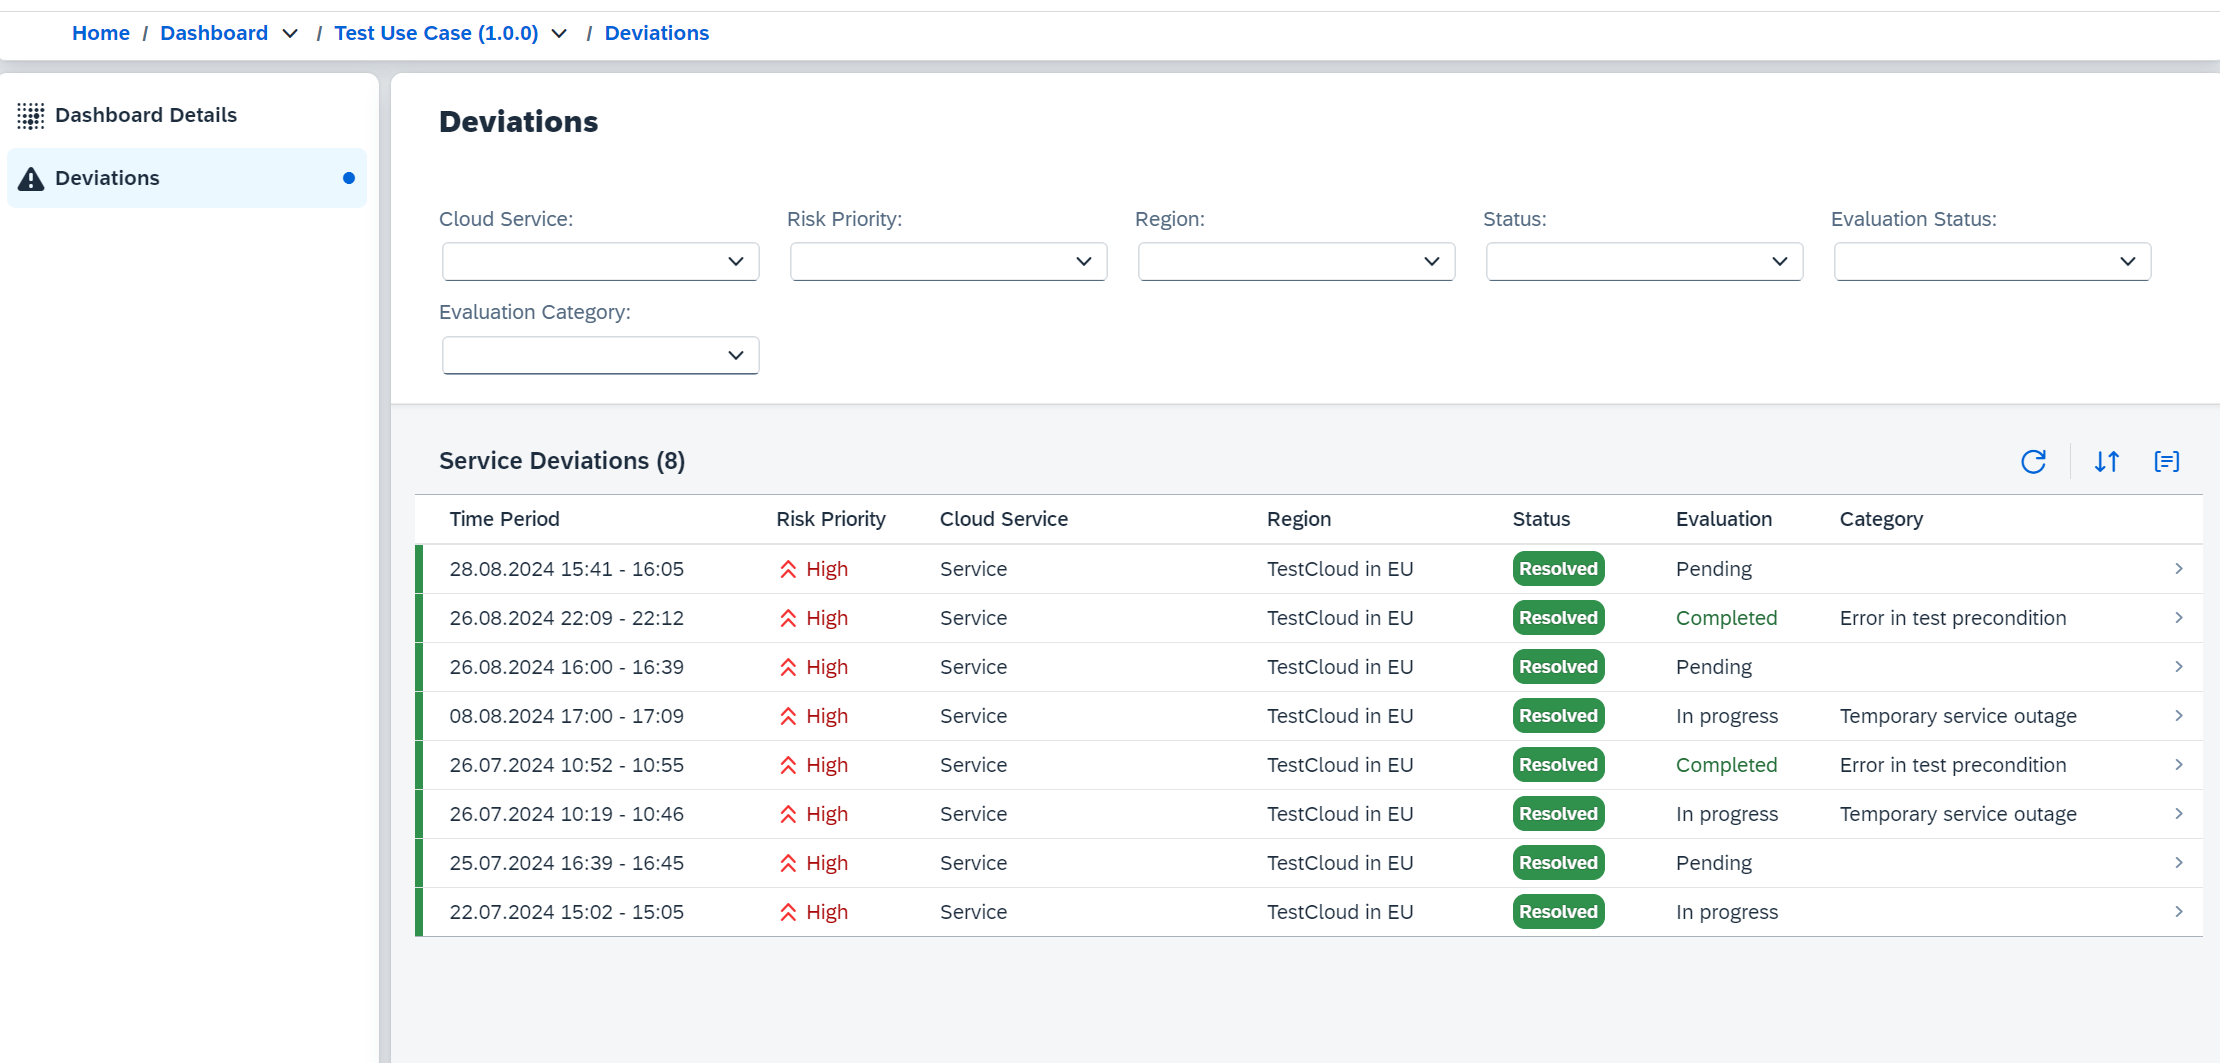
In the Dashboard area, the Deviations section allows you to access all deviations associated with the selected Use Case.
A deviation is created when a test execution fails. All consecutive failing
test executions are grouped under the same deviation until a successful test
run occurs.
 ## Deviation Details
Selecting a deviation from the list opens a detailed view of that deviation. This view provides comprehensive information about the deviation.
### Overview
The Overview tab provides a summary of the deviation, including:
* **Deviation ID**: Unique identifier for the deviation.
* **Status**: Current status of the deviation (e.g., ongoing, resolved).
* **Risk Priority**: The risk priority assigned to the deviation, indicating its severity.
### Evaluation
The Evaluation tab displays the evaluation results of the deviation, including:
* **Category**: The category of the deviation (e.g., Temporary service outage).
* **External Incident Reference**: In case our team has raised an incident for this deviation with the service provider, this field contains the reference to that incident.
* **Result**: The detailed explanation of the deviation evaluation, including the reason for the deviation and any relevant details.
* **Messages**: Additional messages related to the deviation, providing context and insights.
### Technical Details
The Technical Details tab provides in-depth technical information about the deviation, including:
* **Cloud Platform**: The cloud platform where the deviation occurred.
* **Data Center / Region**: The specific data center or region where the deviation was detected.
* **Cloud Service**: The specific service affected by the deviation.
* **Component**: The component within the service that is affected by the deviation.
* **Feature**: The specific feature of the service that is impacted by the deviation.
#### Verification Runs
The Verification Runs section lists all relevant test execution runs associated with the deviation. This includes:
* **Failed Test Execution**: The test execution that failed and triggered the deviation. (All subsequent failing test executions are grouped under the same deviation until a successful test run occurs.)
* **Successful Test Execution**: The test execution that resolved the deviation.
Verification runs can be opened to view detailed information about the test execution. The detailed tab will show additional information such as:
* **Times**: The start and end times of the test execution.
* **Duration**: The total duration of the test execution.
* **Retry Count**: The number of retries attempted for the test execution.
Additional information about the Features impacted will be displayed in the *Verified Features* section.
Clicking on a feature will open the test execution details for that feature, allowing you to see the specific tests that were executed and their results.
## Deviation Details
Selecting a deviation from the list opens a detailed view of that deviation. This view provides comprehensive information about the deviation.
### Overview
The Overview tab provides a summary of the deviation, including:
* **Deviation ID**: Unique identifier for the deviation.
* **Status**: Current status of the deviation (e.g., ongoing, resolved).
* **Risk Priority**: The risk priority assigned to the deviation, indicating its severity.
### Evaluation
The Evaluation tab displays the evaluation results of the deviation, including:
* **Category**: The category of the deviation (e.g., Temporary service outage).
* **External Incident Reference**: In case our team has raised an incident for this deviation with the service provider, this field contains the reference to that incident.
* **Result**: The detailed explanation of the deviation evaluation, including the reason for the deviation and any relevant details.
* **Messages**: Additional messages related to the deviation, providing context and insights.
### Technical Details
The Technical Details tab provides in-depth technical information about the deviation, including:
* **Cloud Platform**: The cloud platform where the deviation occurred.
* **Data Center / Region**: The specific data center or region where the deviation was detected.
* **Cloud Service**: The specific service affected by the deviation.
* **Component**: The component within the service that is affected by the deviation.
* **Feature**: The specific feature of the service that is impacted by the deviation.
#### Verification Runs
The Verification Runs section lists all relevant test execution runs associated with the deviation. This includes:
* **Failed Test Execution**: The test execution that failed and triggered the deviation. (All subsequent failing test executions are grouped under the same deviation until a successful test run occurs.)
* **Successful Test Execution**: The test execution that resolved the deviation.
Verification runs can be opened to view detailed information about the test execution. The detailed tab will show additional information such as:
* **Times**: The start and end times of the test execution.
* **Duration**: The total duration of the test execution.
* **Retry Count**: The number of retries attempted for the test execution.
Additional information about the Features impacted will be displayed in the *Verified Features* section.
Clicking on a feature will open the test execution details for that feature, allowing you to see the specific tests that were executed and their results.
 ### Activities
The Activities tab provides a chronological list of all activities related to the deviation, including:
* **Creation**: When the deviation was created.
* **Updates**: Any updates made to the deviation, including status changes and evaluations.
* **Resolution**: When the deviation was resolved, if applicable.
### Activities
The Activities tab provides a chronological list of all activities related to the deviation, including:
* **Creation**: When the deviation was created.
* **Updates**: Any updates made to the deviation, including status changes and evaluations.
* **Resolution**: When the deviation was resolved, if applicable.